C One-tailed vs. two-tailed tests
C.1 Introduction
The tests we have considered so far have been appropriate for questions of the type: ‘is the population mean, or the difference between population means, different from some value’ (often this value is 0, but it doesn’t have to be). Usually, we simply want to know whether there is any difference. We’ve not been too concerned with the direction of the difference, i.e. if our test reveals a difference between the populations, we would be interested in it whichever way round it was. A test of this sort is called a two-tailed test.
However, there are occasions when we may wish to test a more specific hypothesis. For example if we have measured a variable in two groups, A and B, we might only be interested in whether the population mean of A is bigger than that of B. That is, we set out to evaluate the specific hypothesis that the mean of A is bigger than the mean of B. A test this sort of directional hypothesis is called a one-tailed test.
We’ll examine it one- vs. two-tailed test distinction in the context of a t-test. Just keep in mind that the distinction can arise up in many different situations.
C.2 An example of a one-tailed hypothesis
A farmer has been persuaded to try a new pesticide called Toxic Death on his broad bean crop. He sprays 20 fields of beans with Toxic Death and leaves 20 fields untreated. To test the effectiveness of Toxic Death he is only interested in detecting a positive response in his crop. It makes no difference to the farmer if the pesticide has no effect or proves to reduce the crop yield: in either case the product is a waste of money to the farmer and he will not use it again.
The farmers’ test hypothesis is quite specific, in terms of the direction of the effect that is being tested for: ‘Toxic Death increases the mean yield of broad beans’. This is what is meant by a one-tailed test. In a one-tailed test we are only interested in a positive response, or a negative response. One rapidly descends into a philosophical quagmire when considering what ‘only interested in’ actually means, but let’s work with that definition for now.
Where can we use a one-tailed test?
In what follows we’re only going to consider one- vs. two-tailed tests in the context of t-tests. However, keep in mind that although the one- vs. two-tail distinction mostly pops up when discussing t-tests, it is relevant to some other kinds of statistical tests.
C.3 So how do we perform a one-tailed t-test?
We can use of any of the t-tests we’ve seen (one-sample, two-sample, paired-sample) to examine an hypothesis about means where the direction of the effect is pre-specified. We are interested in testing the hypothesis ‘Toxic Death increases the mean yield of broad beans’ since this is the hypothesis of greatest relevance to the farmer. If the yield of beans in the two treatments was as illustrated below…
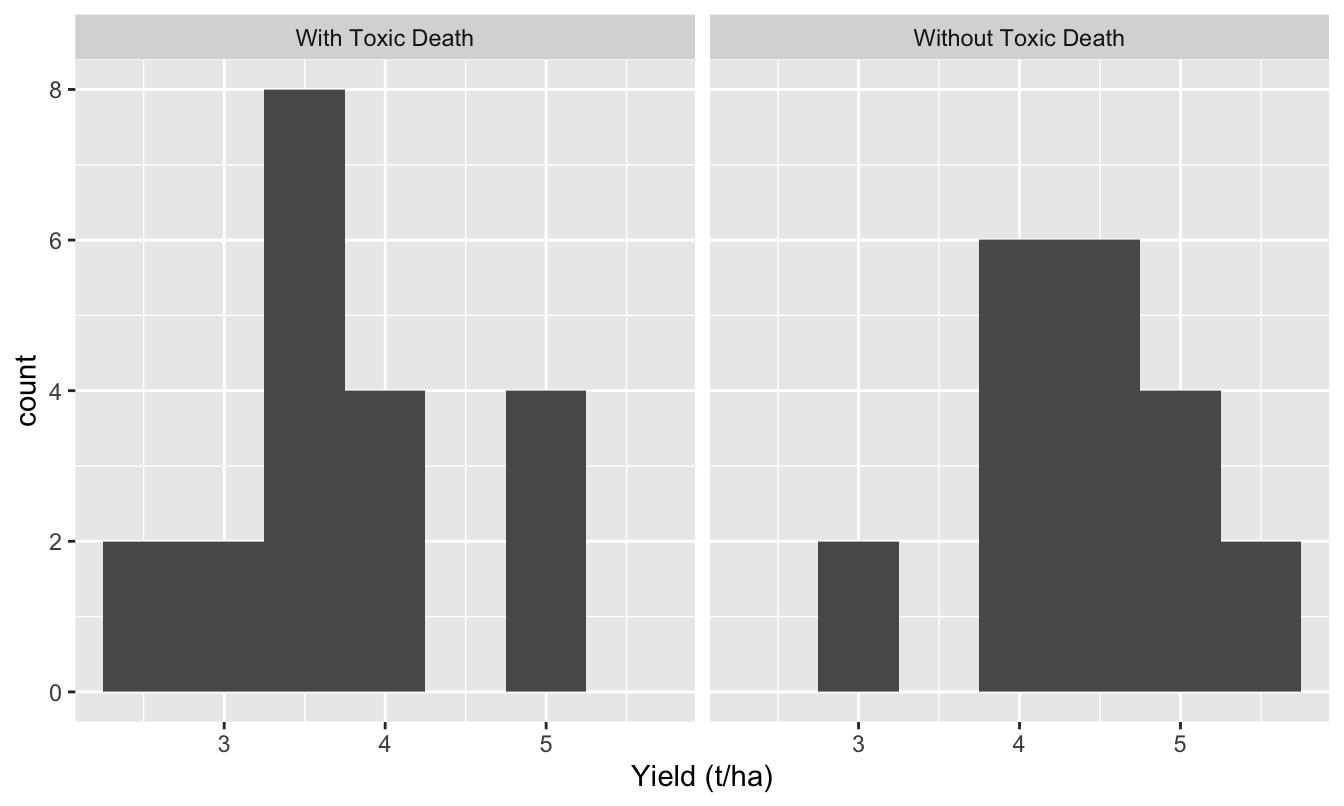
Figure C.1: Toxic death data
…we would not even need to perform a test. The mean yield in the Toxic Death treatment is actually lower than in the control — we can automatically reject the hypothesis that treated fields have higher yield. The Toxic Death salesman might be in for some of his own medicine! However, if the results indicated that the mean yield was greater where Toxic Death was used we then need to to perform the test to determine how confident we can be that this is a real increase rather than a consequence of sampling variation.
The aim is to compare two independent means, so we would use a two-sample t-test. The one-tailed version of the test is no different from the two-tailed version, but for one small tweak: when we come to find the p-value value to judge the significance of the test, the correct probability for a one-tailed test is half that found for the two-tailed test. So, suppose we had performed a two-tailed test (i.e. a test of the hypothesis ‘Toxic Death changes the yield of broad beans’––no direction specified) and found a positive effect of Toxic Death, but with a probability p = 0.08. Performing a one-tailed test of the hypothesis ‘Toxic Death increases the yield of broad beans’ would give a probability of exactly half this (p = 0.04).
In this case using the two-tailed test we would have concluded that there was no significant effect of Toxic Death on the yield of broad beans (p = 0.08), whereas with the one-tailed test we would conclude that Toxic Death significantly increased the yield of broad beans (p = 0.04). This is a rather striking change of conclusion, which may seem like a fiddle40. It is not a fiddle (at least not if used properly). But because using a one- rather than two-tailed test can alter the conclusion we draw, such tests should be used with caution, and the rules about how and when to use them strictly adhered to. These rules are discussed below.
First, we will see how to actually do a one-tailed test in R.
C.3.1 Carrying out one-tailed t-tests in R
You should work through the example in this section.
We said one-tailed tests were not a different sort of t-test to those we’ve seen so far—we can do one-tailed tests with any of these t-tests. We’ll show you how to do it using one example, the paired-sample t-test, applied to drug data.
Let’s go back to the data on glycolipid concentrations in eight patients being treated with Drugs A and B. Imagine now that rather than A and B being two new drugs, Drug A is the existing treatment for the disease, while Drug B is a new type of drug being tested for effectiveness. In this case the drug company is obviously only interested in whether the new drug causes a greater reduction in the glycolipid levels of individual patients than the old one. If it has the same effect, or if it is less effective than the existing treatment it will not be worth spending time and money developing to the production stage. So the company’s test hypothesis is: ‘The new drug (B) is more effective than the existing treatment (A) at reducing glycolipid levels’. Let’s test this.
Download the GLYCOLIPID.CSV file from MOLE again if you don’t have it and place it in your working directory. Read GLYCOLIPID.CSV into an R data frame, giving it the name glycolipid, then remind yourself what the data looks like, e.g.
## Rows: 16
## Columns: 4
## $ Patient    <int> 1, 2, 3, 4, 5, 6, 7, 8, 1, 2, 3, 4, 5, 6, 7, 8
## $ Sex        <chr> "Male", "Female", "Male", "Female", "Female", "Male", "Fem…
## $ Drug       <chr> "A", "A", "A", "A", "A", "A", "A", "A", "B", "B", "B", "B"…
## $ Glycolipid <dbl> 142.9, 140.6, 144.7, 144.0, 142.4, 146.0, 149.1, 150.4, 13…
We’re going to use a paired-sample t-test again in this example. We just want to rerun the previous analysis using a one-tailed version of the test. In order to do this we have to set one more argument in the t.test function, called alternative. This can take one of three values: "two.sided", "less", or "greater". The first option is the default used by the t.test function. We pick a one-side test with an associated direction of effect by choosing “less” or “greater”. Here is how it works:
##
## 	Paired t-test
##
## data:  Glycolipid by Drug
## t = 2.6209, df = 7, p-value = 0.01718
## alternative hypothesis: true difference in means is greater than 0
## 95 percent confidence interval:
##  0.7863436       Inf
## sample estimates:
## mean of the differences
##                  2.8375
Most of that output should seem quite familiar by now. However, why did we set the alternative to “greater”? We wanted to assess whether drug B really leads to lower glycolipid concentrations. Let’s make sure we understand what is going on…
Look carefully at the mean of the differences in the output. This is a positive number: it looks like R has assumed we want to examine the ‘Drug A - Drug B’ differences between pairs. It does this because the letter ‘A’ comes before the letter ‘B’ in the alphabet. That’s all! It doesn’t actually matter which way round we calculate the differences—the t-statistic will be the same. However, we do have to be very careful to ensure that the direction of the alternative hypothesis we choose is correct. It is very easy to get this wrong if we are not paying attention, which is why R always prints the mean.41
Compare this with the output from the two-tailed paired-sample t-test on the glycolipid data (we just drop the alternative = "greater" argument):
##
## 	Paired t-test
##
## data:  Glycolipid by Drug
## t = 2.6209, df = 7, p-value = 0.03436
## alternative hypothesis: true difference in means is not equal to 0
## 95 percent confidence interval:
##  0.277451 5.397549
## sample estimates:
## mean of the differences
##                  2.8375
The output differs in two respects:
The alternative hypothesis in the one-tailed test (the
alternative hypothesis:line) is:true difference in means is greater than 0. This tells us that R has tested whether the mean of our sample of differences is greater than zero42.The p-value in the one-tailed test is exactly half the value it is in two-tailed test, i.e. the result is ‘more significant’ when done as a one-tailed test. This is the primary advantage of the one-tailed test: it has more statistical power.
Also note that in this case, the drug effect was significant in both one- and two-tailed tests, but it is not always so.
Our conclusion from this test would be:
Individual patients had significantly lower serum glycolipid concentrations when treated with Drug B than when treated with Drug A (one-tailed test: t=2.62, d.f.=7, p=0.017).
Note two things about the conclusion. First, we should specify that a one-tailed test was used. If no information is given it is conventional to assume a two-tailed test has was used. Second, it is sensible to put the actual probability level, rather than just giving the category for p. This is because if anyone does then want to see what the significance of the two-tailed test would have been, they can easily double the probability, which cannot be done if we just say p < 0.05.
C.3.2 When to use, and not to use, one-tailed t-tests
Whether we use a one- or two-tailed tests can sometimes appear to change our conclusions rather dramatically…
There is an obvious temptation here! It would be easy to collect data, determine which mean value is larger, and then test for differences in that direction using a one-tailed test.This would increase the apparent significance of the results, but it is a fundamentally flawed analysis. Why? Well, if we do this we are implicitly doing a two-tailed test—we are going to test the effect whichever direction it goes in—while using the extra power of a one-tailed test by pretending only one direction was ever going to be considered.
It is very important to get clear in our mind about what one-tailed tests do and when (if ever) we might legitimately use them. The key principle is that the direction of the predicted effect must be specified before the data are collected. We are then effectively forfeiting the right to test for differences in the opposite direction to that predicted—we are putting all our statistical eggs in one basket. We are saying we are not interested in testing the result if it is in the opposite direction to that we predicted. That’s a very strong stance to adopt.
What this means is that one-tailed tests are never appropriate in investigative research. Just because we have an idea about which direction we think an experimental result might go in is not a good reason to just test for that and effect in that direction. Instead we need to ask whether or not we would genuinely be prepared to ignore a result in the other direction. Usually the answer is no. For example, if we dose the soil in which experimental plants are growing with a low concentration of a particular compound we suppose will be toxic to them, we might expect that their growth will be reduced. However, if in fact they show higher growth with the compound than without it, we would almost certainly want to test to see if this was a real effect43. We would, therefore, be better off using a two-tailed test.
Similarly in the case of testing a new drug against an existing treatment, on the face of it we may primarily be interested in whether the new treatment is better than the old one, and might consequently think of the analysis as one-tailed. However, we may also be interested in whether the new treatment is actually worse that the old one, rather than simply the same—i.e. an effect in the opposite direction to that we predict. Why? Well perhaps the new treatment has fewer side effects, so even if it is only of the same efficacy as the old one, it may still be preferable. However, we would most definitely want to ensure that it was no worse. So a two-tailed test is probably still be the most appropriate analysis.
If there are so many problems why use them?
There are situations where we are only interested in the direction of the effects, rather than understanding mechanisms. Here one-tailed tests are a useful tool. Testing medical or veterinary interventions for efficacy might be one (as discussed above). Another is in situations such as industrial processes: if we are in charge of managing the production of blood test kits, and we are considering a change to the production process we might want to sample the production line under the old and new systems and test whether the new system has a lower failure rate. We are only interested in an improvement—if the change has a higher failure rate, or simply makes no difference, we are not going to convert the entire production process to the new system. Here the extra power to detect an effect in a specified direction would certainly be worth considering44.
One-tailed tests have their uses (and sometimes appear in statistics books focussed on biological data) but they should be used with caution. The default procedure should be to use a two-tailed test unless there are very good reasons for doing otherwise.
For one, the p < 0.05 threshold is just a convention↩︎
This is also another reason for why it is important to really understand your data before you start analysing it. You have been warned!↩︎
Remember, the differences are ‘the wrong way around’ relative to our scientific hypothesis, so this is the right test.↩︎
Perhaps the compound also contains important trace nutrients, or affects the microbial community in the soil.↩︎
In this situation we might also need to consider whether a p < 0.05 threshold is really appropriate. If it is going to cost millions of pounds to alter the industrial processes, do we really want to make such a change when our test has a 1 in 20 false positive rate?↩︎